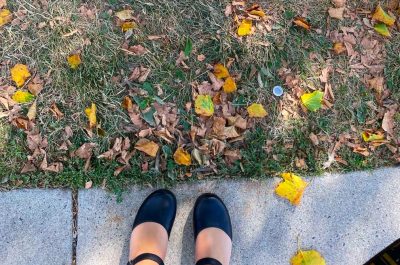
So, you take a photo, send it to ISeeChange and post a short note about what you see in your town or backyard. How might that help us understand a changing climate?
Our partners at the Earth Observation and Modeling Facility at the University of Oklahoma can answer that, because they’ve been collecting photos for five years. They’ve compared thousands of photos from the public, to scientists’ work, to see what they reveal about the landscape.
And you’re a part of that.
One last time, it’s Field Photos Weekend – our quarterly call for landscape shots and your thoughts – and so we thought it was a good time to get the science minds in Oklahoma to tell us what we’ve found out about drought around the United States from all those photos.
But first, let me hip to you an important (observable) milestone: it’s the 25th anniversary of one of my desert-island movies: Sneakers. It stars Robert Redford, Sidney Poitier, David Strathairn, Dan Aykroyd, and River Phoenix as a team of electronic “sneakers” who have to surveil and code-break their way to freedom.In my third favorite scene, the team’s trying to find a “little black box” – a piece of hardware that cracks any code – in a scientist’s office.Four pairs of eyes keep missing what’s right under their noses; it takes Strathairn’s character, a blind hacker named Whistler, to catch on to where it is.
As Sneakers tells us, and as we’ve told you before, the value of having so many personal, local, overlapping observations is that it makes it harder to miss something important. Which brings us back to our Field photos.
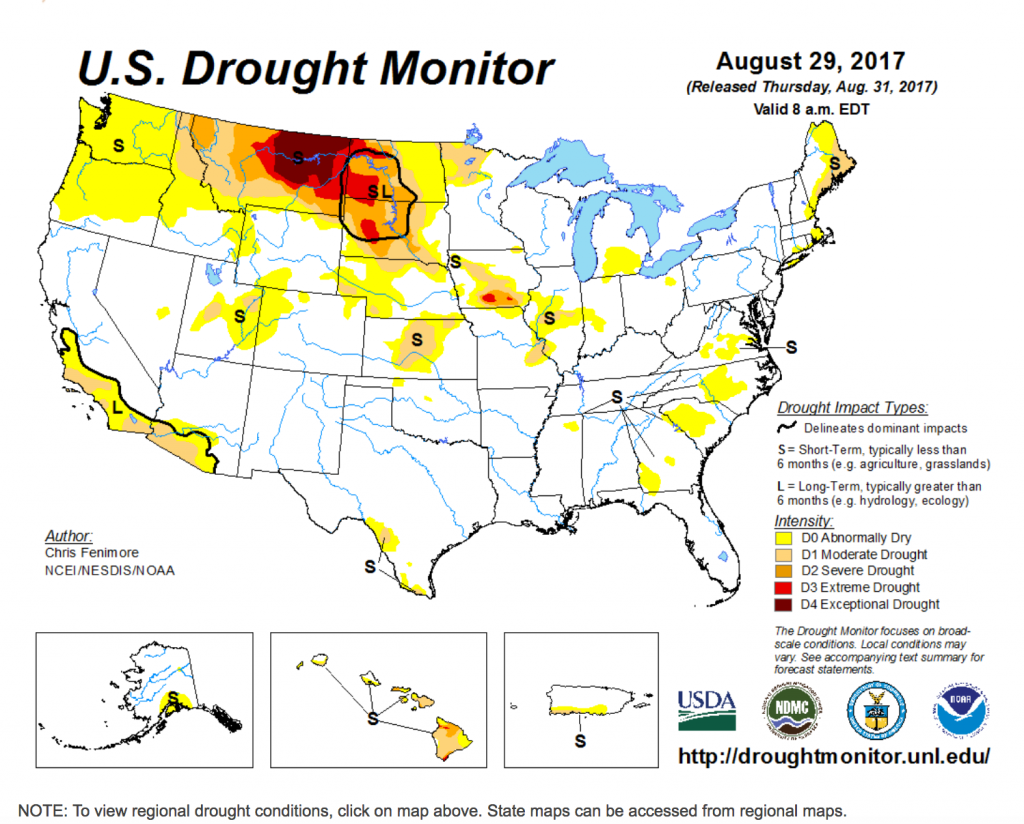
At the University of Oklahoma, graduate student Darrian Bertrand, with the help of another student, Gina Fujan, looked at every single one, assigning it a value from the National Drought Monitor’s five-level classification scale. No doubt you’ve seen this before- it’s a map shaded yellow, orange and red depending on the severity of a drought.
“We really do just need to become more familiar with some of these landscapes where it’s harder to tell whether there’s drought or not,” Bertrand says.
From the jump, the National Drought Monitor tells you that it’s not great at the details:
“Although it is based on many types of data, including observations from local experts across the country, we don’t recommend using it to infer specifics about local conditions,”
So says a note from the USDA’s National Drought Mitigation Center, at the bottom of a page explaining the classifications.
Bertrand had two questions: Can our photos fill in the gaps? Can we create a “damage” scale that does for drought what the Fujita Scale does for twisters?
The answer to both is….maybe. So far, it’s working better in some places than others.
But in at least two regions, public-generated pictures weren’t very consistent with National Drought Monitor classifications. And we still don’t know why.
New England Sightings
According to Bertrand, New England photos tend to match federal drought categories…except at certain times of the year. “In May [around Memorial Day], when you have everything kind of blooming, the pictures were more helpful and spot on with what the actual drought monitor category was,” she says.
May 1: Typical New England spring. Warm one day, looking for sweatshirts the next.
Apple and early blueberry blossoms are fully out. No frost in the 10-day forecast, but may dip into the 30s at night a couple of days. Fingers are crossed for no repeat of last year’s cold.
“However, by September [Labor Day], during our other event, there’s a lot more overestimation and underestimation of the drought.”
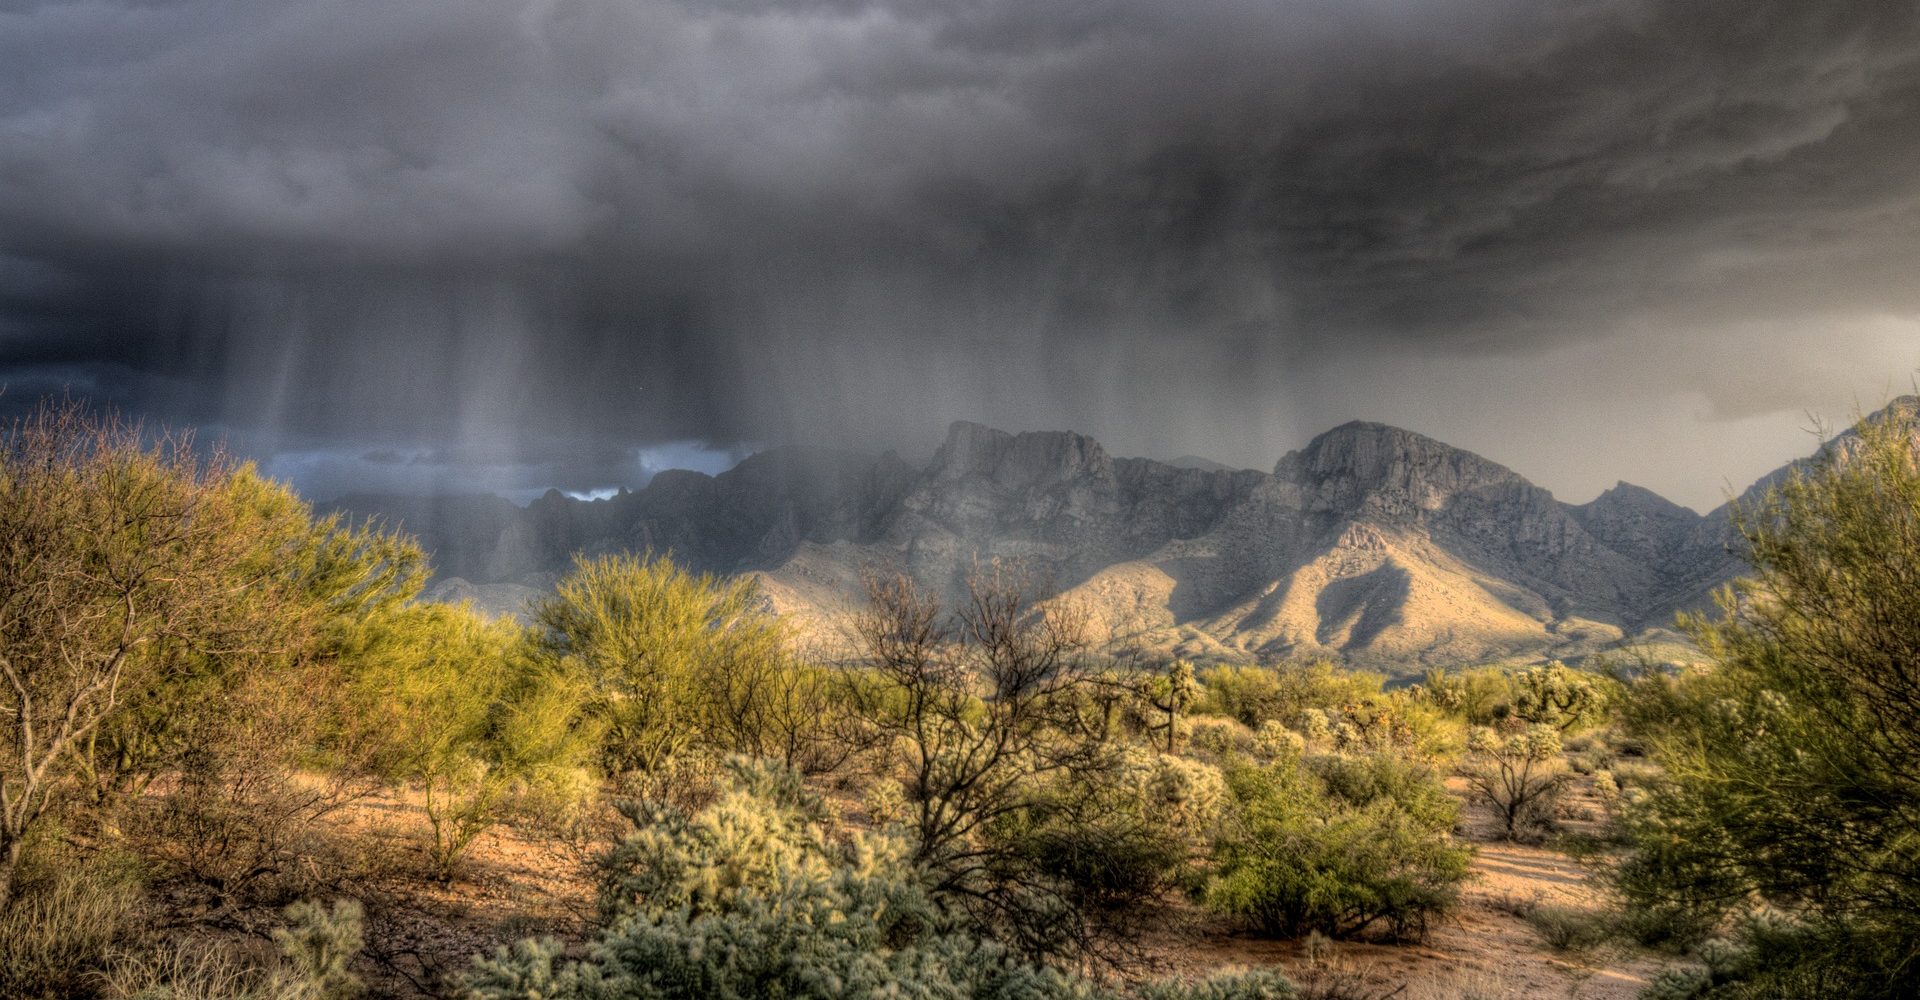
Southwest Sightings
And in the Southwest, what the public saw is raising very compelling questions about using public photos for climate science. That’s because Bertrand says there were great differences between what the federal drought map shows there, and what she saw in our photos.
She admits that discrepancies could exist because the researchers didn’t know what they were looking at. “We were actually terrible at deciding if they’re in drought or not,” she says. “It was funny – we would look at this same picture of this cactus year after year, is it more brown, is this actually drought. It turns out they’re not in drought so much, when we thought they actually were.”
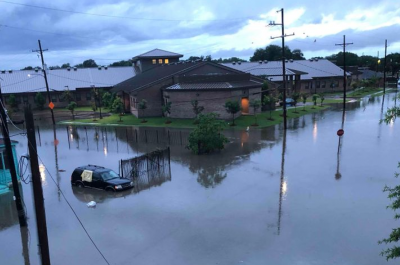
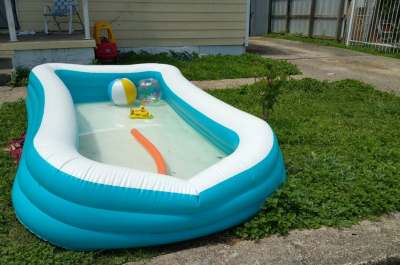
Classification differences could also happen because people sent in accidentally misleading pictures – like of a place where there had been a fire, not necessarily drought. Or because people observed landscapes altered by human activity, like golf courses and dammed-up lakes.
Bertrand points out one more possibility: all those local observations may be creating what scientists want a more complex understanding of drought.
To confirm whether that’s happening, we need more photos. “I think that would help, since we had fewer pictures from west of the Rockies than east of them,” she says.
After looking at 179,000 snapshots, Bertrand has advice about how to make your observations most useful. The most important: a zoomed-out picture of a landscape is better than a close-up shot of one plant. You can read more about how to have a great Field Photos weekend in some previous stories.
In the meantime, ISeeChange is still building a more detailed picture of the desert Southwest with the help of people like Betsy Wilkening, from Tuscon, Arizona. Back in May, she showed us what saguaro cacti looked like in her yard.
After the wettest July ever, Wilkening showed us how monsoon rains have affected some cacti near her, halfway through the rainy season. We’re looking forward to what we’ll see from her after this weekend.
So, one last time: get out there and see something. Because science depends on it.
Story for ISeeChange by Molly Peterson