Fershid Aspi spent many summer days waiting to cross the street at an intersection in Boston’s Chinatown neighborhood. He described the intersection as “barren.” With no trees, but plenty of pavement, the wait became unbearably hot.
Barren intersection in Chinatown. Hot spot to wait at the signal.
Aspi, who has lived in Boston for over three decades, said that summer hot spells seem to be getting hotter and lasting longer – and he’s right: In 2019, the National Weather Service recorded 15 days above 90°F in Boston, a 4.7 day increase from the city’s 1980-2010 average.
“You get the feeling that air conditioning back in the 90s was nice to have, but now it’s necessary, while you don’t need it the whole summer, there are these extreme hot spells,” Aspi said.
The increasing severity, length and frequency of heat waves poses heightened risks to the health of residents. Heat exposure kills more people in the U.S. than all natural disasters combined. According to the Climate and Health Assessment, it is very likely that the number of summertime heat-related deaths increases by thousands to tens of thousands in the U.S. by the end of the century.
As such heatwaves are becoming a major concern in urban areas across the U.S. In 2015, residents in Harlem, New York City documented indoor heat on ISeeChange and monitored temperatures with heat sensors. They found that indoor air temperatures in apartments in Harlem were up to seven degrees hotter than outdoor temperatures.
Similar to New York, Boston’s buildings, infrastructure, and public spaces are not designed with for extreme heat exposure in mind. To engage and educate residents about urban heat throughout Boston and surrounding communities, the Museum of Science ran a citizen-science project called Wicked Hot Boston throughout the summer of 2019. Volunteers could participate by sharing photos and stories of how the heat impacted their daily lives on ISeeChange and by driving pre-selected routes with a heat-monitoring device on their car.
The project’s leaders, the museum’s David Sittenfeld, Sara Benson and Katie Baur, were interested in pursuing a project around urban heat because of its ability to engage a wide segment of the community and because of the growing risk of dangerously high temperatures in the area.
“Heat really popped out to some of our resilience planning partners as more of a concern that potentially first anticipated,” Sittenfeld wrote. “And one that is connected to the very old building stock we have in our historic communities, the relatively few units with central air conditioning, and the large changes we’re experiencing here with respect to land use and zoning as entire neighborhoods are re-envisioned.”
The making of Wicked Hot Boston
The Museum of Science team took cues from the work of Jeremy Hoffman, the chief scientist at the Science Museum of Virginia in Richmond. In 2017, Hoffman took a heat-mapping strategy created by researchers at Portland State University and applied it to Richmond.
“I said wouldn’t it be great if we could do one of these heat island studies,” Hoffman said. “Using people instead of scientists, you know, let’s get community volunteers to do the assessment.”
He saw it as a chance to get Richmond residents engaged with science in an easily accessible way, and one that could potentially provide them with the knowledge to create more livable neighborhoods. He worked with community organizations to bring people together to provide input on the areas of the city that they were interested in studying. Then they created routes and teams of citizens drove the routes and collected heat data. This data provided a clearer picture of the city’s urban heat challenges than was possible via satellite, and it has been used in city planning.
No break from the sun waiting for the bus on Sunday schedule.
For the Boston project, ten areas within the cities of Boston, Cambridge and Brookline were selected, community members gave input into the places that they viewed as important to measure, and routes were created. The 50 volunteers split into small groups then drove those routes on set days at 6 a.m., 3 p.m. and 7 p.m. Aspi heard about the project from his neighborhood association and signed up to participate in the mapping.
“It was a lot of fun, going through the nooks and crannies of the city, and there was camaraderie with the folks you were working with,” Aspi said. “It was very gratifying.”
— K Marino
The data they collected was passed on to modelers who created a heat map of those ten locations and combined it with land use and land coverage data to estimate temperatures in other parts of the metro area.
Meanwhile residents who were unable or uninterested in participating in mapping, as well as mappers like Aspi, began to create a record of their experiences with heat on ISeeChange.
“This allows everyone to be a part of something,” said Nancy Smith, program manager for community engagement for the Boston Public Health Commission. “You might just be like, ‘Hey I want to go outside, take a picture of this, and post it up.’ There’s a platform for you to talk about what’s going on in your own local area, your street.”
Results highlighted the power of shade
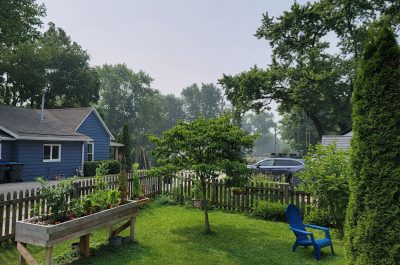
Community observations posted on ISeeChange emphasized the importance of shade and green spaces in keeping cool.
Suzanne Mrozak’s house is shaded during the hottest parts of the day which helps allow her to get by without an air conditioner. She said that if there is a stretch of three or more days with temperatures above 90°F, she finds that she has to sleep downstairs near the fan, but other than that the heat is typically bearable.
“We have shade, we have trees, there are gardens,” she said. “We went to a party for the Fourth of July and sat out in this really nice shady garden backyard with people who had permeable pavers in their driveway, you know, it’s a privileged situation.”
In September, the Museum of Science hosted a forum to discuss the results of the project. Both Smith and Asip were in attendance along with other local officials, community leaders and residents.
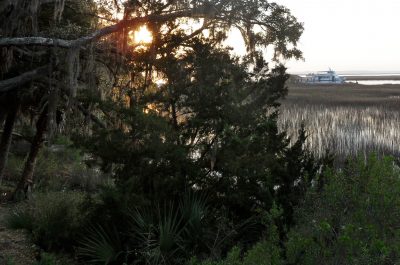
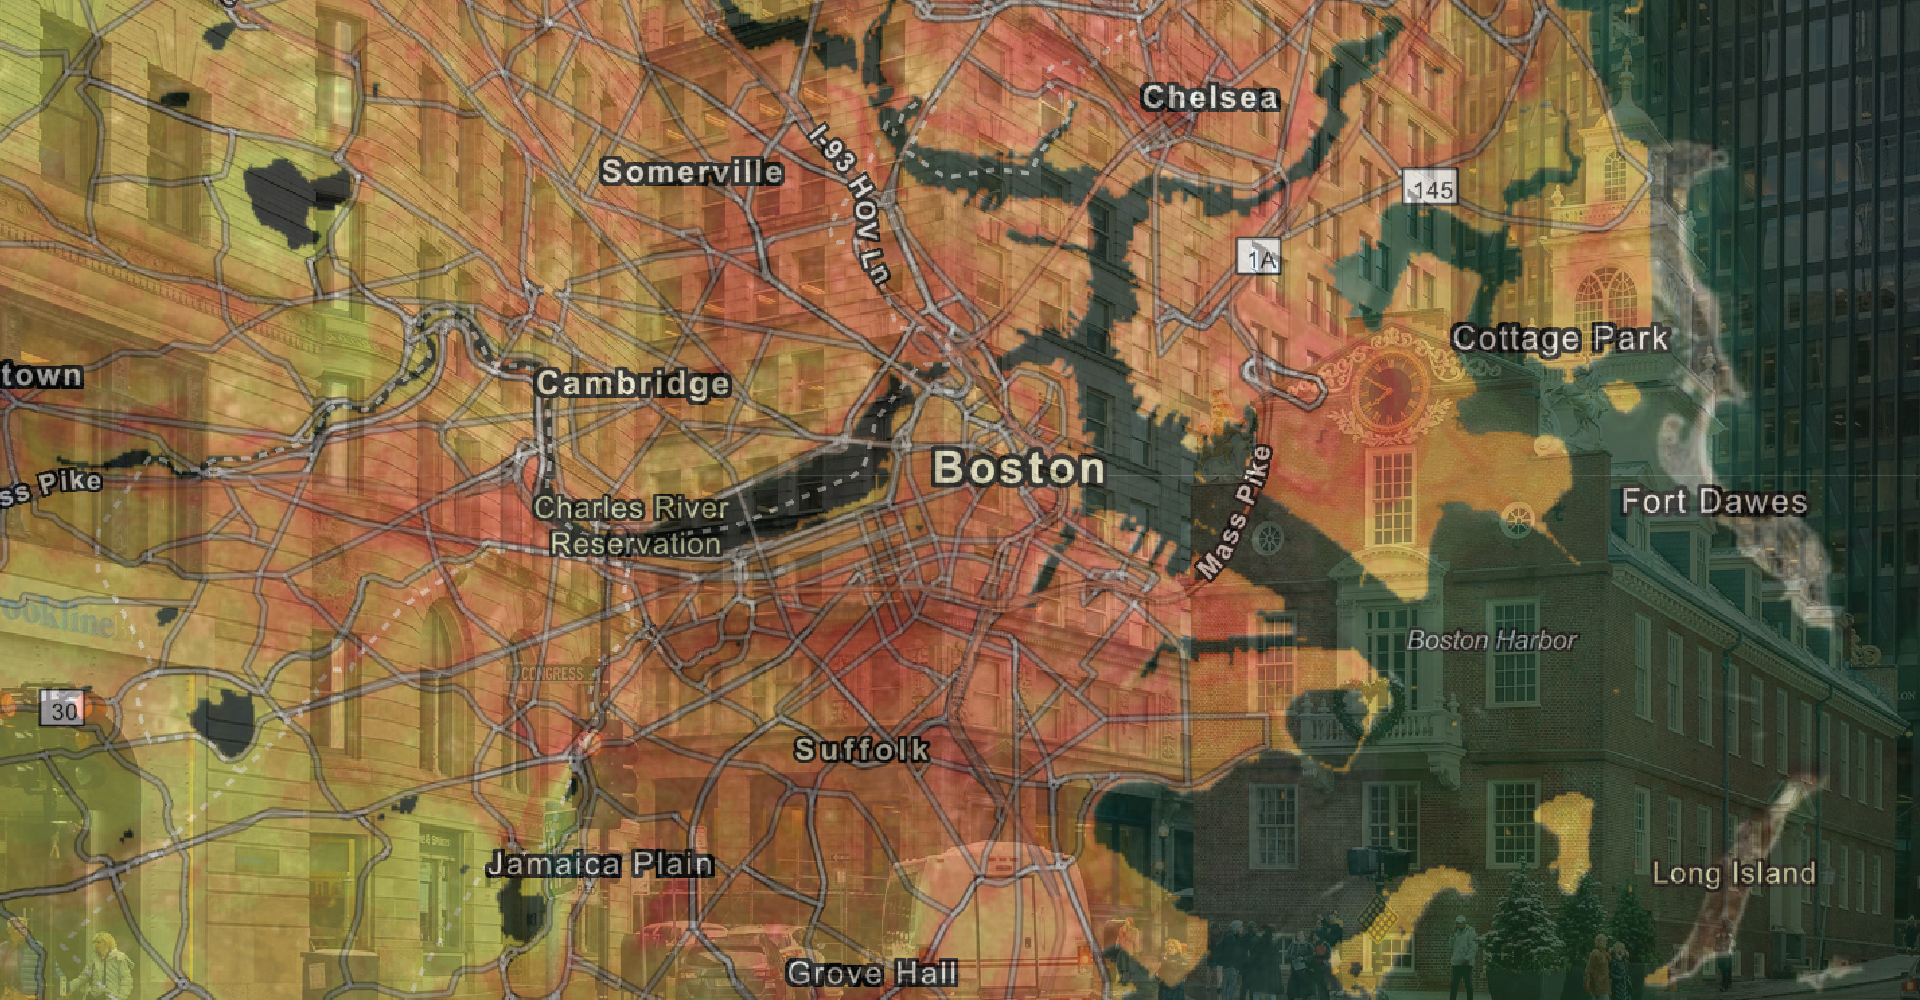
The findings were consistent with the urban heat island effect. Locations without much greenspace warmed up quickly and got hotter, while areas near water and trees were more stable and didn’t get as hot. In particular, their heat mapping results demonstrated just how valuable a role that shade plays in keeping communities cool. The hottest areas, of those that were mapped, were in the Southend, East Boston, Seaport, North End and Dorchester neighborhoods where shade was lacking.
One Dorchester location was the hottest spot measured. “It was recorded as having a temperature of 102.5°F when the average temperature was about 90° at that time, so about 12.5 degree difference,” Sittenfeld said.
Many of those hottest areas also corresponded to areas with large low-income populations, and areas with a higher than average percentage of people of color.
S. Atyia Martin, the CEO and founder of All Aces, Inc., has worked in resilience planning and racial equality in Boston. She said that preparing for extreme heat in Boston is not as prominent an issue as it needs to be within conversations around climate change in the city. More money and focus has been on the risks associated with sea level rise. “From a heatwave perspective, it’s mentioned in a lot of reports, but it doesn’t get as much attention because of who it impacts,” she said. “Collectively as a city we have a long way to go to get on the same page.”
Smith echoed Martin’s concerns about inequality and heat vulnerability. At the forum, she was surprised to learn that the Southend, where her office is, was among the hottest locations in the city. She said that the area is where the largest group of organizations providing services for vulnerable people, like people who are ill or experiencing homelessness, are located.
Smith also noticed that Northeastern University, her alma mater, showed up as a cool spot on the maps and that the University had been taking initiatives to grow the campus tree canopy.
“It’s something to really look at because we really want to make sure that we’re doing the best for everybody,” Smith said. “Do some of these buildings over here, do they need to have white roofs? There’s just all this new stuff that’s now coming out now that we know that we’re right in the heart of the hottest area.”
Next steps
Looking toward the summer of 2020, the Museum of Science and ISeeChange are excited to grow community understanding of heat in the city.
The Wicked Hot Boston team hopes to map locations that aren’t accessible by car by collecting data while biking and walking. More engagement is needed in some of the hottest communities to better understand local exposure. Tracking the impacts of wind as well as how land coverage changes from pavement to greenery in the same location might affect temperature. A new citizen science project will also be launched to help educate residents about flood risks in the city. By 2020, ISeeChange will have new sensor APIs available to sync qualitative data posts to both real-time heat and flood sensors.
Meanwhile, Boston area city officials and planners like Smith hope to incorporate the heat data collected through the project into neighborhood improvements. And residents are hopeful that their work on the project will result in a cooler city.
“What I heard from the city planners was very encouraging,” Aspi said. He hopes that there will be regular conversation between officials and citizens so that he can stay informed about how the research he contributed to is being incorporated into plans to improve and cool the city.
Cover photo: Foreground map via the Museum of Science; Background photo by Mobilus in Mobili via Flickr.