Find out when high and low temperatures are unusual in your area!
For many ISeeChangers the cool temperatures of fall came late this year with heat and humidity lasting well into October. Last month was the third-hottest September on record in North America and the fifth-hottest worldwide.
With climate change happening all around, it can be hard to keep track of what is truly unusual. One study found that it only takes between two and five years for people to normalize what was previously abnormal weather. To help our community avoid this “shifting baseline syndrome,” ISeeChange has introduced a new feature that alerts users when the daily high or low temperature in their area is abnormal.
What you see
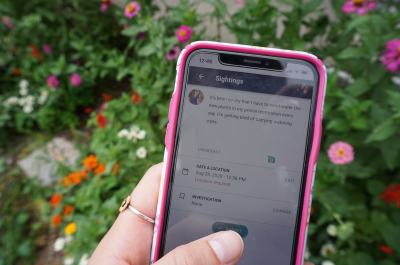
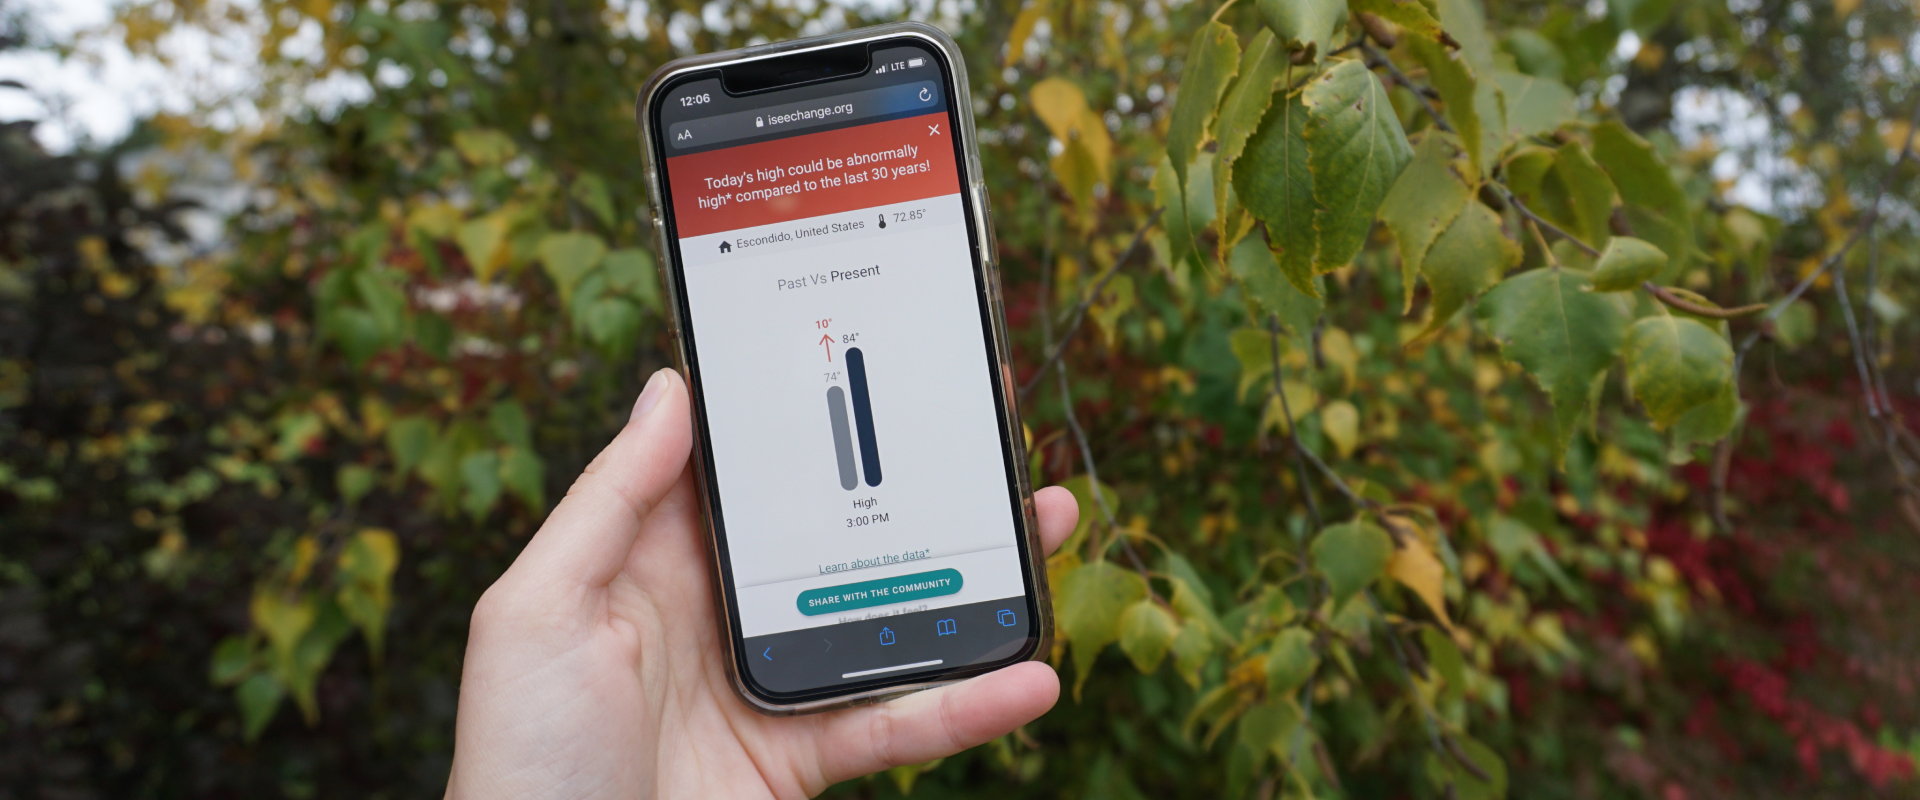
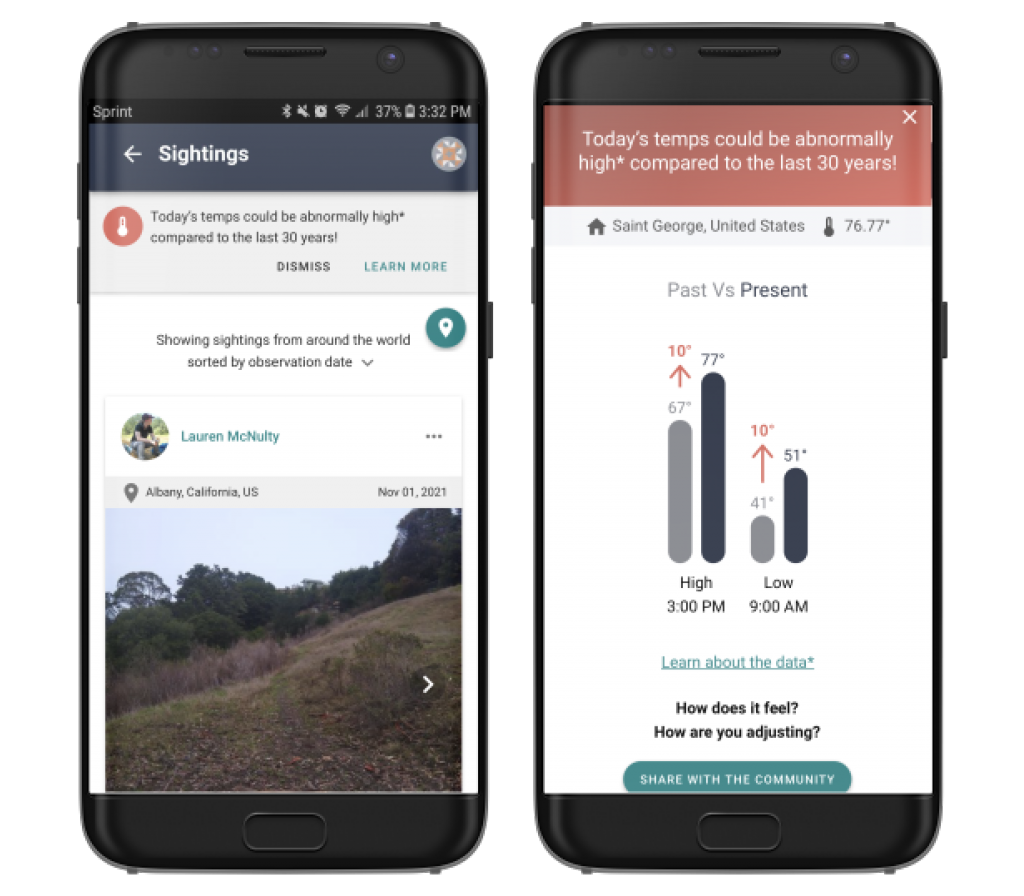
You will see a banner alert on the top of the ISeeChange website or mobile app on days when the expected high or low temperature is unusual compared to the average daily high and low temperatures for this week over the last 30 years.
Clicking “learn more” on the banner will pop up a chart that shows just how different today’s temperature is. When you create a post on a day with an abnormal temperature, an alert icon will appear next to the temperature on the sighting.
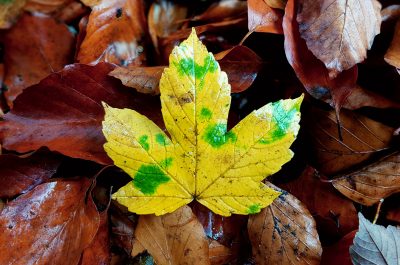
We hope ISeeChangers use this new feature to inform their sightings. For example, you might create a new post and describe your reaction to the abnormalities. Or you might look for signs of changes in your natural environment (like late-blooming flowers during a warm fall) and share them.
How it works
The ISeeChange team developed models to analyze historical weather data and compare it to the present. We use the following logic to notify you and differentiate how outside of the average today’s temps are from the last 30 years:
![]()
- Less than 1 standard deviation away (or is within 68% of the data points closest to the average), we don’t notify you
- Between 1-2 standard deviations from average – we tell you today’s weather is “higher” or “lower”
- Between 2-3 standard deviations from average – we tell you today’s weather is “much higher” or “much lower”
- 3 or more standard deviations from average – we tell you today’s weather is “extremely high” or “extremely low”
- Sometimes, the historical weather data does not have a neat bell curve. This doesn’t mean the temps noted are normal, but, unfortunately, we can’t tell you how unusual the temp is compared to the last 30 years. Instead, we inform you that the data “could be abnormal*” when it is at least one standard deviation away because record breaking temperatures can still exist in these scenarios and we could use your help documenting them!
Fall 2021 strangeness
When you receive an alert that your temperature is abnormal you may post sightings like these:
What does it feel like?
What are people wearing?
How do trees and other plants look?
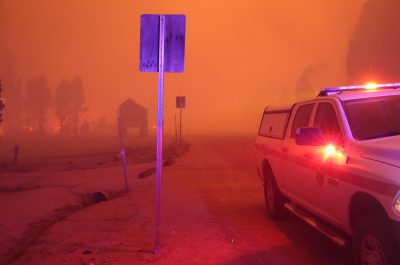
The cedars and big leaf maples in WA are suffering from the extreme hot days and very dry summer.
What is the precipitation like? Is it stormy or dry?
Contact us with questions
Please feel free to reach out to us at inquiry@iseechange.org with any additional questions.