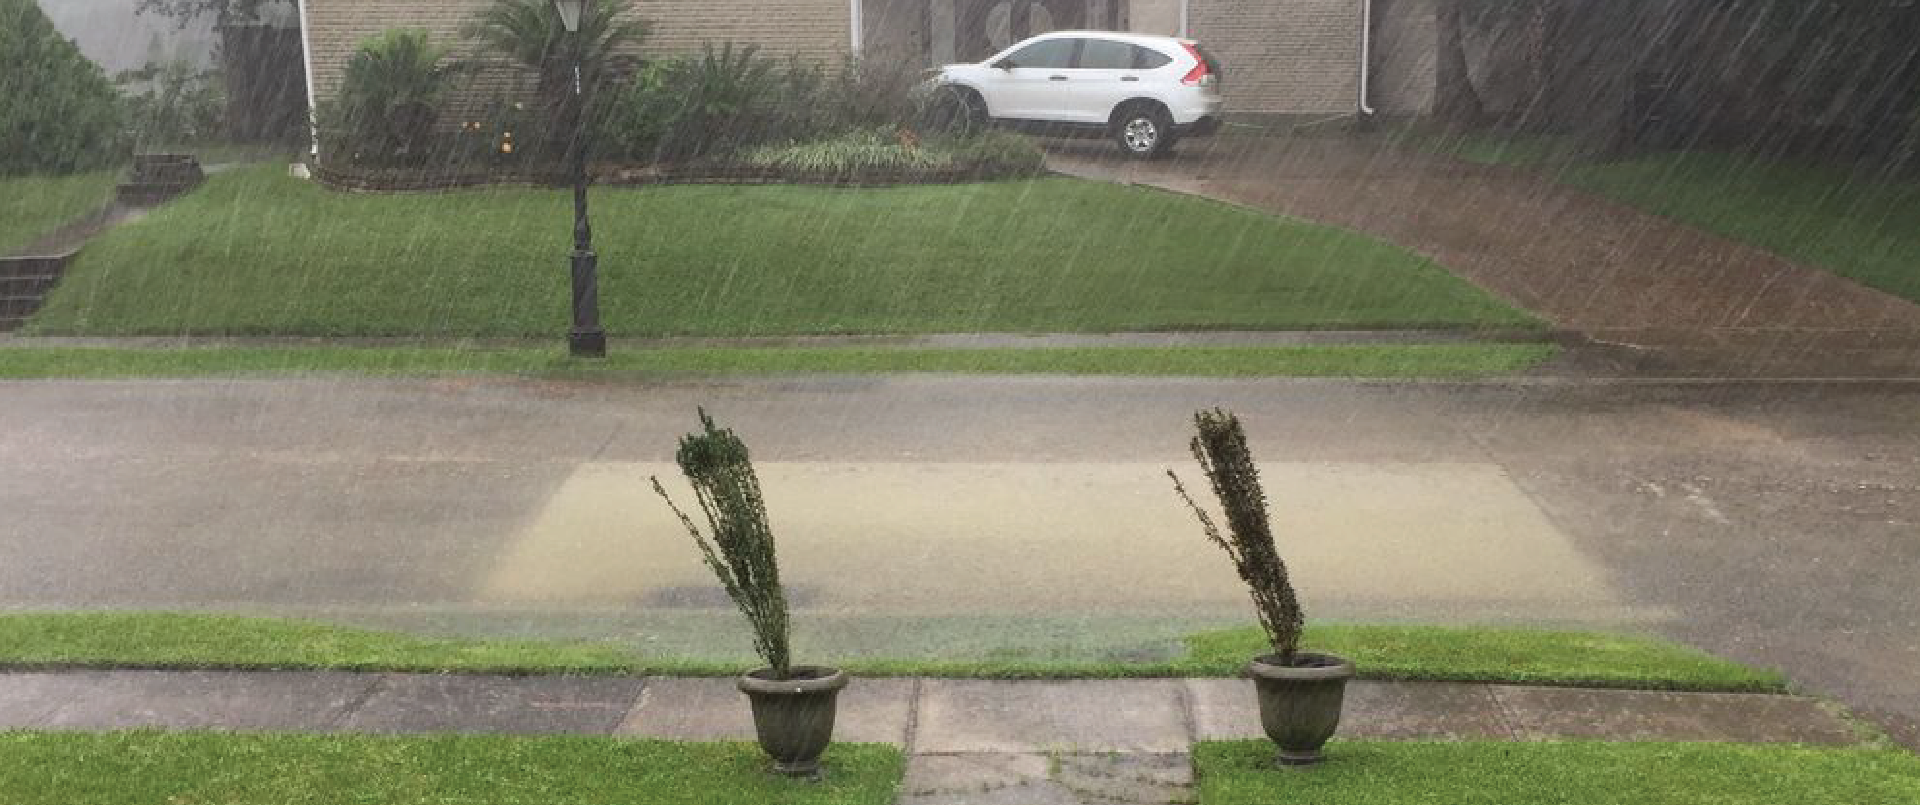
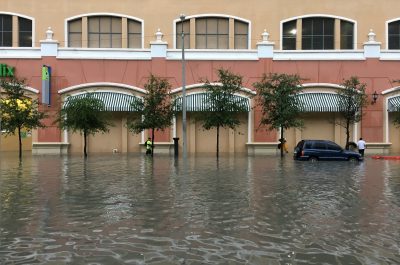
Flooding in New Orleans complicates commutes, causes damage to cars and homes, and makes residents question whether it’s safe for their kids to walk through stagnant puddles to get to their bus stop. The city is working on new drainage infrastructure projects aimed at alleviating residents’ concerns, coping with climate change and combating subsidence.
You are the expert on your block. You know where the regular puddles and potholes appear. So any data you can share helps design infrastructure that works for you. That data can come in the form of photos of flooding and in rainfall totals.
And it’s not only how much rain we get that matters, it’s how much rain we get in what amount of time. How intense a rainstorm is impacts how much flooding we see. For example, if your neighborhood gets two inches of rain in a day, you’ll see much less flooding than if those two inches fall in a half hour.
Our partners in Gentilly are looking for more details about how different rain intensities affect our streets, homes, and daily lives. In particular, we are on the look-out for photos and stories from a two-year rain event in New Orleans. A two-year event is a rainstorm intensity that has a 50 percent chance of occurring each year. In New Orleans that looks like this:
5 minutes: 0.628”
10 minutes: 0.919”
15 minutes: 1.12”
30 minutes: 1.71”
1 hour: 2.31”
2 hours: 2.90”
3 hours: 3.27”
6 hours: 3.92”
12 hours: 4.64”
24 hours: 5.41”
2 days: 6.22”
3 days: 6.66”
4 days: 7.04”
7 days: 8.04”
If we get an event like this, we need to know what it looks like on your street and in your yard. Document any flooding, or puddling you see. Tell us how a rain storm like this impacts you – your daily commute, your kid’s school, your business, your health and more. In the meantime, continue to post photos and observations from any and all rain events and other weather and environmental changes you see.
Every sighting and every story matters.


