When ISeeChange started in 2012 in Colorado, it was the warmest year in the continental United States. A lot of weird stuff happened that year.
What could top that?
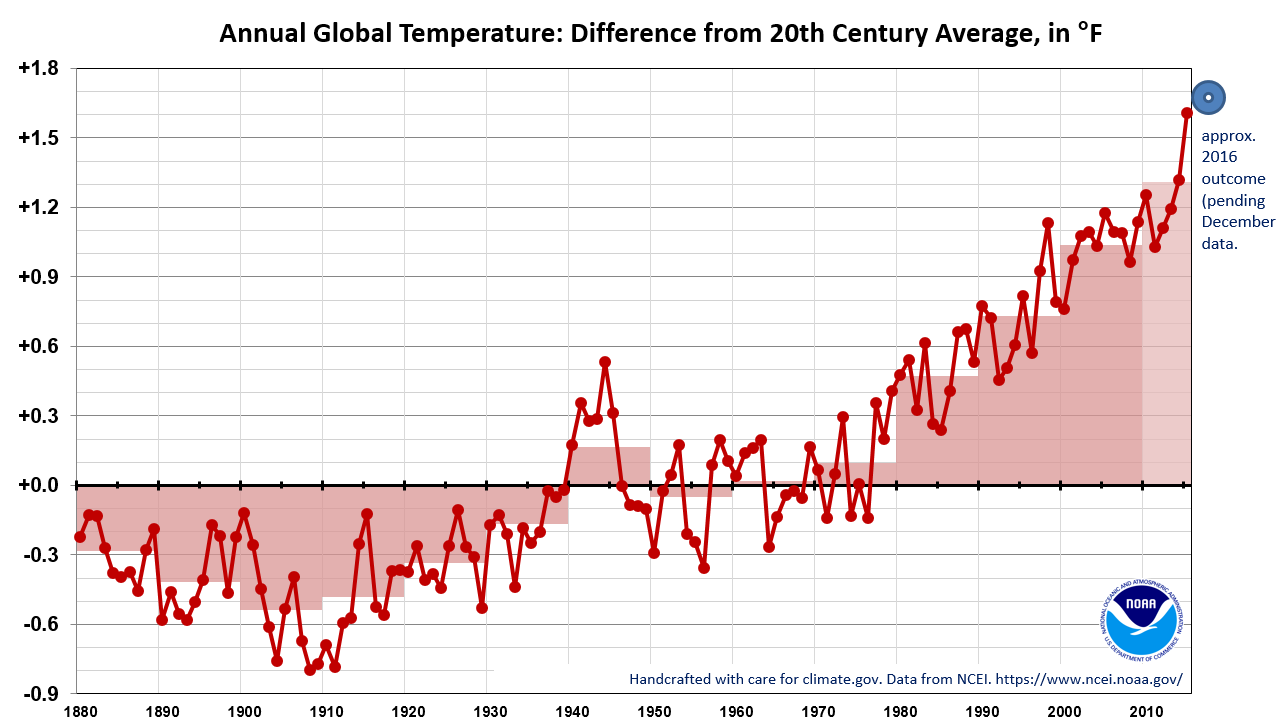
2016 came second to that CONUS record. Almost every state in the lower 48 experienced above-average annual temperatures, according to scientists from NOAA’s National Centers for Environmental Information. Globally 2016, will blow up last year’s temperature record, like a new Beyonce album explodes the Internet. None of these things are surprising, per se.

But what IS unusual is that the last three years in a row were the world’s warmest years on record. Now that is one hot hat trick.
2016 was also an EXPENSIVE year. The U.S. experienced 15 “billion-dollar disasters,” causing a total of $46 billion in damages. This was the second highest number of billion-dollar events recorded in the last 37 years, second to 2010.
Finally, we saw the global average surpass 400 parts per million of carbon in our atmosphere…our chimp-crossover cousins from the Pliocene last saw that happen about 4 million years ago. Something has changed.
Every single one of our contributors is helping to piece together this history as it happens, and creating their own personal climate records.
Thanks to our partnership with NASA, you can keep track of carbon over time in every ISeeChange post, like this one from Wendy Young in Lynville, Indiana, by clicking the satellite icon:
What You’ve Seen Change 2015-2016
As we look back on the last two years alone, we saw and reported a lot together- often before anyone else noticed. Here’s just part of what you all reported on in real time:
- Longer (never-ending sometimes) growing seasons
- The California and Pacific Northwest droughts and wildfires
- The Pacific Ocean “Blobs” and their effects on Pacific marine life
- The forgotten three-year long drought in New England
- Nationwide tree mortality events in 2016
- Marine ecosystem shifts and erosion off the Atlantic Coast and Cape Cod
- Increasing ticks, mosquitoes, and vector-born diseases in the Northeast (some cause meat allergies!?!)
- Record-breaking winter warmth 2015-2016 that brought early blooms and balmy holidays
- 500-Year flooding events and record precipitation pattern disruptions on the Atlantic and Gulf Coasts
- Harmful algae blooms in the Gulf Coast
- Disrupted monsoon signals in India (in January!) before record-breaking summer heat waves
- Strange humidity, cloud patterns, alongside extreme heat in United Arab Emirates
- Coffee tree stress and catastrophic flooding in Rwanda; more monsoon weirdness in Cameroon
- Central Canadian wildfires (not to mention the caterpillars!)
- Australia’s early spring and unheard of storms and flooding
- Air Pollution in Hong Kong alongside typhoons
- Gypsy moths munching, even our Christmas trees
- The health impacts of urban heat (more on that below!)
- And the role that drought and pests may be having on Central American migrants’ decisions to cross the border.
ISeeChange Tracker App
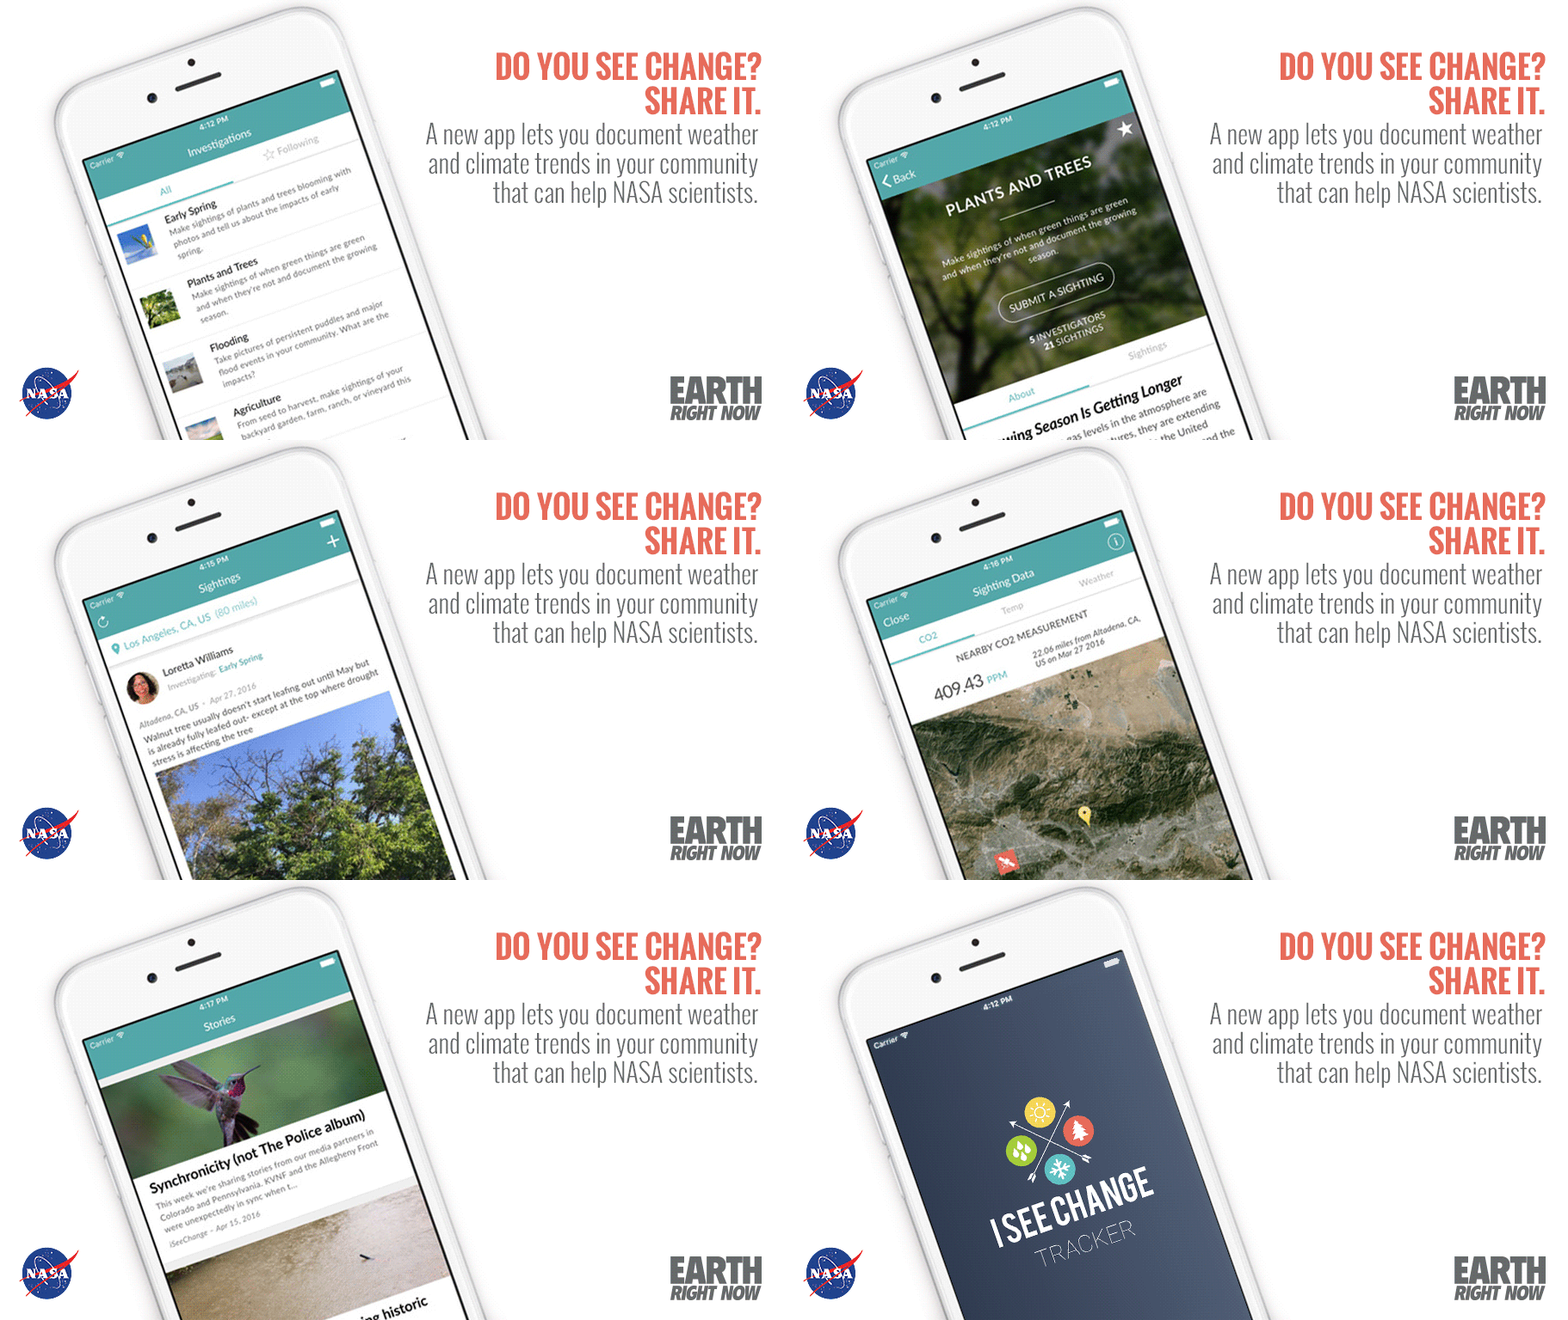
Last spring, we released our first mobile app in collaboration with NASA’s Jet Propulsion Laboratory and the Orbiting Carbon Observatory Mission. The app allows ISeeChange community members to contribute to specific investigations over time and help NASA uncover and “groundtruth” details that earth observation satellites can’t see from space.
We’re happy to say we just updated the app and fixed a few features after the iOS updates dropped this fall. It’s back, better than ever, and we’re going to be adding new features in 2017 to help us notify our community when we see interesting things changing near them.
We’re also going to launch (soon!) an Android version and bring in some new visualizations we hope will help connect our members to each other and the changes they’re seeing. Stay tuned for more from us and NASA!
Community Investigations and Local Impact
In 2016, ISeeChange also collaborated with partners across the nation to call communities together to document the impacts of weather and climate on daily life using the app and platform. Local and community investigations included:
-
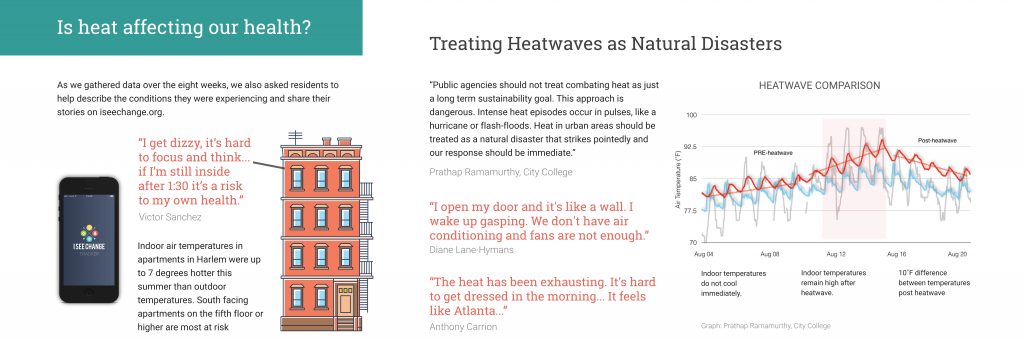
Our “Harlem Heat” investigation explored the public health risks of urban heat, using a combination of crowdsourced observations on ISeeChange, sensor data reporting, and narrative journalism.We partnered with AdaptNY, WNYC Radio, WE ACT for Environmental Justice, and scientists from CUNY. We worked directly with residents in Harlem, using open sensors to measure indoor heat and humidity, then matching their data with ISeeChange story posts.
Impact: This pilot investigation produced unprecedented, unique data that, together with residents’ stories, suggest the need to reassess how heat advisories are issued, rethink public housing policies on air conditioning, and scrutinize adaptation strategies like cooling centers. At the end of the summer, we held a solutions workshop where community members designed their own adaptation projects to test and document next summer.
We are so proud of this work and look forward to continuing and expanding our urban heat investigations along with our community partners. We’ll be posting the full results soon for you to see and download soon.
-
Our Field Photo Investigation is creating a photographic index of drought nationwide, again working with some super partners, including CoCoRaHS, a network of 20,000 rain gauge observers, Southern Climate Impacts Planning Program (SCIPP), and the Earth Observation and Modeling Facility (EOMF). Photographs and text on the ISeeChange Tracker app and platform will be compared to the U.S. Drought Monitor, as well as carbon and temperature data already available.
Impact: Initial findings suggest that drought “looks” and behaves differently in different places and that local communities need to be directly involved in drought monitoring. Adoption of the ISeeChange platform by a local school in Connecticut in the middle of the New England drought is providing more “eyes” on the ground to monitor stressed trees, forests, and groundwater.
— Ryan Lim
Looking ahead to 2017 and Beyond
ISeeChange is gearing up to crowdsource flooding and subsidence in New Orleans, working with local and national partners in targeted neighborhoods. A combination of photographs, crowdsourced stories, rain gauges, and other tools will be tested to create a record of standing water, infrastructure impacts, and storm events in the city.
ISeeChange is also hoping to turn more attention to coastal communities, working with residents, scientists, and engagement partners to adapt ISeeChange tools for fishermen and residents to document their experiences – focusing on the multiple stressors of sea level rise, extreme precipitation, land loss, and stressed marine ecosystems. The baseline stories and data will be used to kickstart conversations to empower community coastal planning and adaptation.
In the next two years, we will focus on adding more analysis and intelligence to the ISeeChange platform to allow integration of our posts with climate models and external mapping clients, resulting in more collaborative community adaptation planning. We aim to deepen our reach into communities nationwide by providing tools to help community members visualize their stories and data, sending custom notifications as we see trends developing, translating the app and platform for our growing Spanish-language users; and providing more anonymity options for those who feel that posting puts them at risk.
As always our eyes and ears are glued to every one of our community members here and across the globe. We have new stories already in the works – Yo-yo winter, anyone? We’re on it, and we’re hearing so far about slips and dips in the “shoveling economy?” Tell us more!
These are the subtleties of climate change that are easily fly under the radar of those who are still on the fence.
But even as we look to the new year, don’t forget to look back and share your 2016 sightings and beyond—just click on the calendar icon and change the date to archive what you want to remember about this historic time.
Every sighting and every story counts.
All of our heartfelt thanks to you – our partners and co-authors of climate history,
Julia and the ISeeChange Team
Lead photo by Catrin Austin/Flickr

